LaTeX templates and examples — Charts
LaTeX can be used to produce a variety of different charts and diagrams, including: flowcharts, gantt charts, pie charts, branching and decision trees, family trees, histograms, bar charts and more. If you're looking for a particular type of chart that isn't featured here, please let us know, or submit your own example to the gallery.
Recent
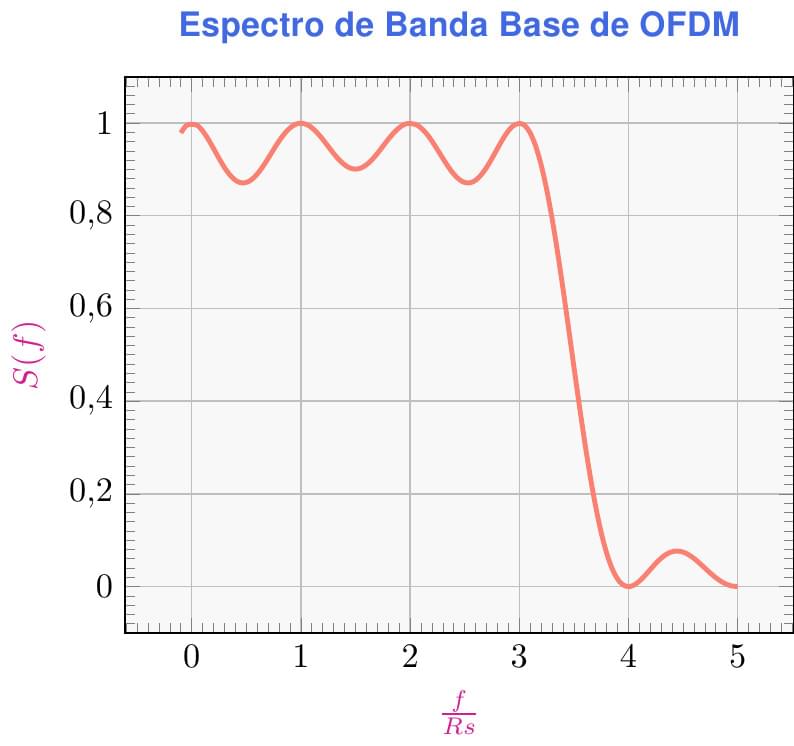
La rutina que les presento, muestra el gráfico real de la distribución de potencia espectral o, simplemente, espectro en potencia, de una señal en banda base de OFDM (Orthogonal Frequency Division Multiplexing, Multiplexado por división de frecuencias ortogonales) que consiste en la suma de 4 señales senoidales portadoras moduladas en algún tipo de técnica digital como ASK, PSK, QAM o cualquiera de sus variantes (de M niveles todas ellas). El espectro de cada señal portadora es la función sinc(x), que se define en el listado, elevada al cuadrado, de la que proviene la función ofdm(x) también definida allí. Esta rutina corrige el ejemplo titulado "Espectro de OFDM" (publicado en https://www.overleaf.com/articles/espectro-de-ofdm/xxcsbsjjtbcb) En la "Sección de sumas de portadoras" se usa la orden \pgfplotsinvokeforeach{0,...,3} para calcular la suma de los espectros de las 4 portadoras moduladas. Para evitar las distorsiones de los gráficos, los límites se han cambiado desde -0.1 hasta 5. La curva en color "Salmon", representa la suma de todos los espectros individuales. El eje horizontal representa la fracción f/Rs, donde Rs es la velocidad de símbolos OFDM transmitidos versus S(f) que representa la potencia normalizada al valor de 1. El gráfico está basado en el mostrado en la página 642 del texto "Digital Modulation Techniques, 2nd Edition" de la editorial Artech House, Inc. de Fuqin Xiong.
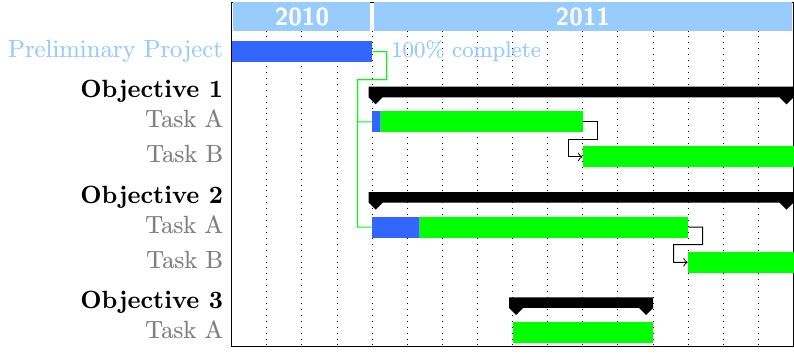
This is a direct copy of the codes in section 2.9 of the pgfgantt package documentation (See page 45) except the color setting. Alone with this one, this examples shows how to make Gantt charts for project planning in LaTeX with the pgfgantt package. They are from the package documentation. The pgfgantt package provides many useful macros for generating the calendar for the Gantt chart for either absolute or relative dates. It also provides macros for grouping and linking tasks, and for full control over the styling of the chart.
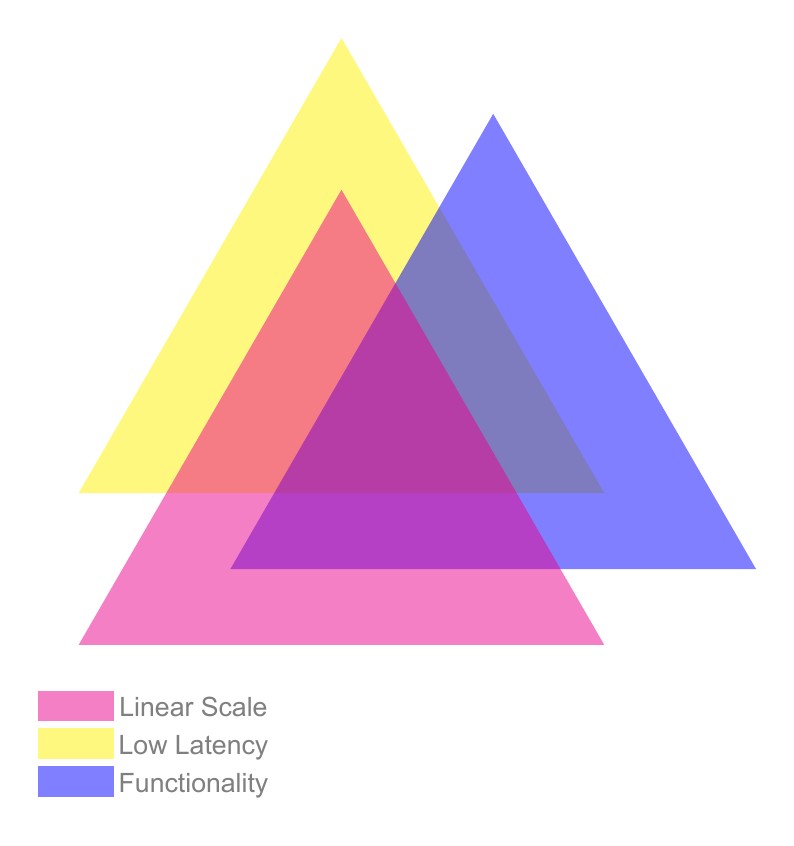
A Venn diagram with triangles
\begin
Discover why over 25 million people worldwide trust Overleaf with their work.